CAC payback period asks how long a new customer’s gross profit takes to recover the cost of acquiring that customer. It is useful because a campaign can look profitable over a long forecast while consuming more cash than the business can support today. The calculation is only as reliable as its cost boundary, gross-margin definition, cohort timing, refunds, churn, and collection schedule.
VISUAL LESSON
What you will learn
- 01Define a consistent CAC and gross-profit boundary.
- 02Calculate payback for recurring and project-based revenue.
- 03Model the cash and retention risks hidden by an average.
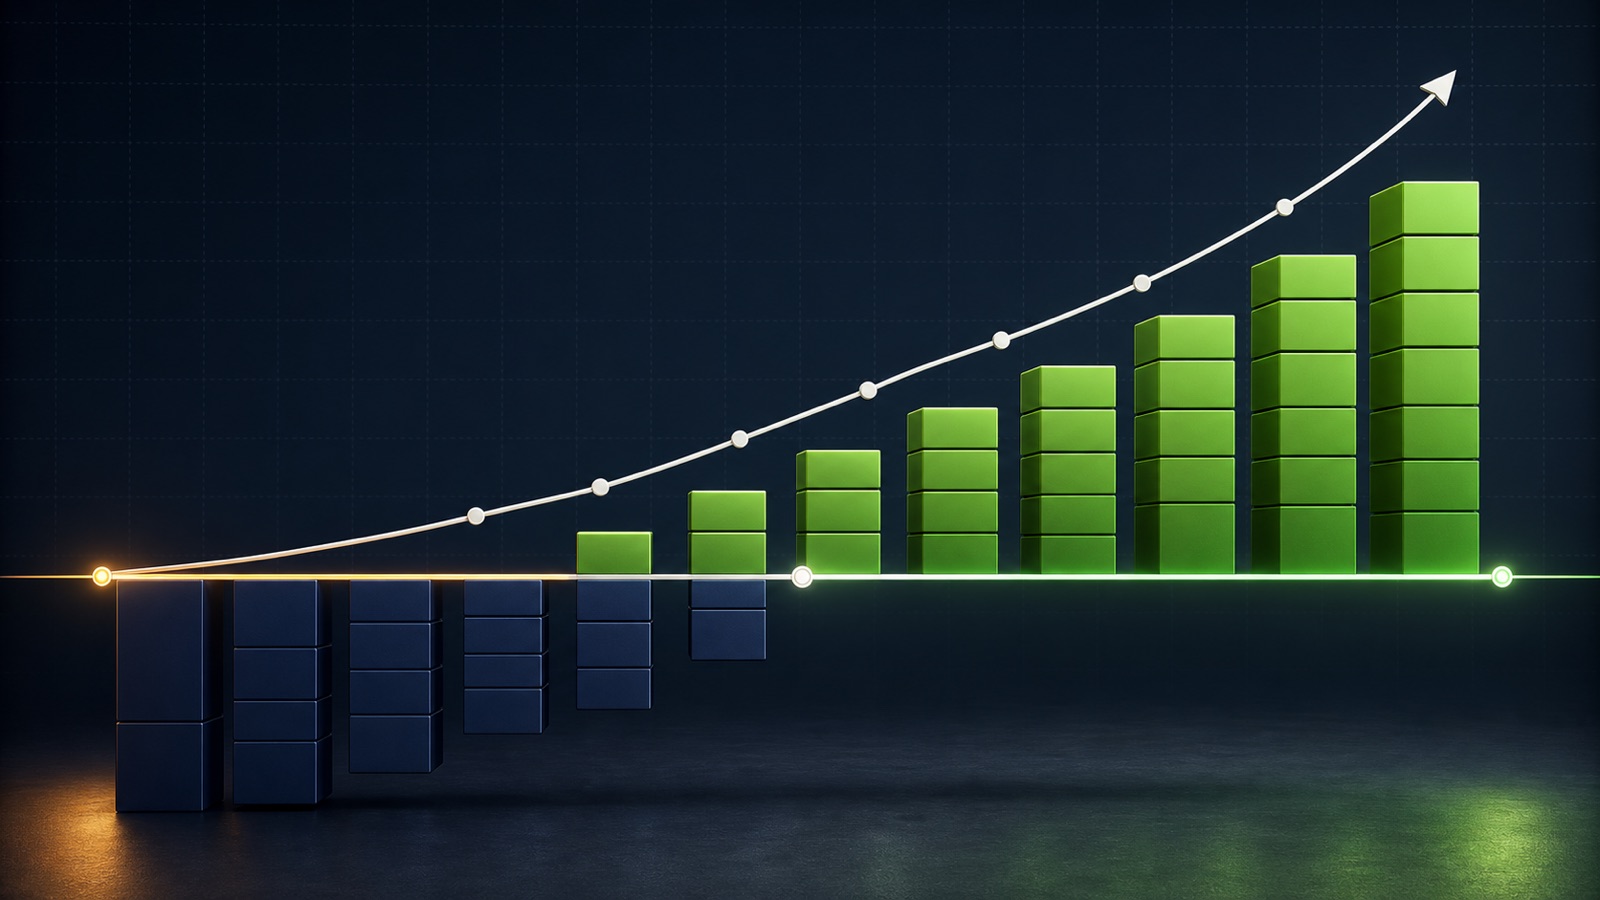
ILLUSTRATIVE $1,200 CAC
Cumulative gross profit crosses payback during month four
PAYBACK WORKSHEET MAP
Calculate the curve from one customer cohort
Choose source, campaign, market, customer start date, and a mature enough observation window.
Include the approved marketing, sales, research, offer, labor, and tool costs within the stated CAC definition.
Subtract direct delivery costs, account for timing and losses, and find the point cumulative contribution recovers CAC.
THE PAYBACK CURVE
Acquisition cost recovered by cumulative gross profit
THE LEAD ATLAS METHOD
Lead Atlas Data can produce a campaign-specific business-contact list for selected categories, locations, and markets, letting the company calculate a clearly labeled outbound acquisition cost and payback period instead of mixing research with unrelated channels.See how custom list research works ↗Define acquisition cost consistently
Choose whether CAC includes ad spend only, marketing program costs, sales labor, commissions, list research, creative, tools, discounts, and overhead allocation. A channel-optimization CAC and a fully loaded company CAC can both be useful, but they must be labeled separately.
Divide the defined acquisition cost by verified new customers from the same cohort and attribution rule. Do not use total leads or platform conversions as customers.
Use gross profit, not revenue
Gross profit is collected revenue minus direct costs required to deliver the product or service. Those costs may include materials, payment fees, fulfillment, support, hosting, labor, or other variable delivery costs according to the business model.
Document refunds, cancellations, bad debt, discounts, taxes, and revenue-recognition timing. A high-margin assumption can make payback appear faster than cash actually returns.
Calculate recurring and project payback
For stable recurring gross profit, an initial estimate is CAC divided by average monthly gross profit per customer. A $1,200 CAC and $350 monthly gross profit implies 3.43 months, so cumulative payback is crossed during month four in the simplified example.
For projects, usage, or uneven renewals, build a monthly cumulative schedule instead of averaging. Payback is the first period when cumulative realized gross profit equals or exceeds CAC.
Model retention and cash constraints
Calculate by acquisition cohort and channel because recent customers have not had time to mature. Show the share of customers that churn or fail to pay before expected payback and model conservative, base, and strong cases.
A theoretically attractive payback can still exceed available cash, sales capacity, or service delivery. Compare the acquisition schedule with when invoices are collected and when costs are paid.
Complete the cohort workbook
Choose one mature acquisition cohort. List fully defined cost, new customers, monthly collected revenue, direct cost, gross profit, churn, refunds, and cumulative gross profit. Calculate median and distribution where customer values vary widely.
Deliverable: the payback curve, assumptions, cash requirement, sensitivity cases, channel comparison, and a scale, improve, hold, or stop decision without borrowing a universal “good” payback benchmark.
THE TAKEAWAY
Use fully defined acquisition cost and collected gross profit by cohort, show the payback curve rather than one universal benchmark, and scale only within the business’s cash and delivery capacity.OFFICIAL REFERENCES