Customer lifetime value can be a simple historical estimate or a predictive model. For a small business, the first useful version is transparent: average purchase value, purchase frequency, customer lifespan, and gross margin, with acquisition cost kept visible. Revenue CLV shows sales generated; gross-margin CLV better reflects the amount available to cover acquisition and operating expenses. Neither is a guarantee of future behavior.
VISUAL LESSON
What you will learn
- 01Calculate simple revenue CLV and gross-margin CLV.
- 02Compare acquisition or product cohorts without hiding assumptions.
- 03Use CLV with CAC, payback, and sensitivity ranges.
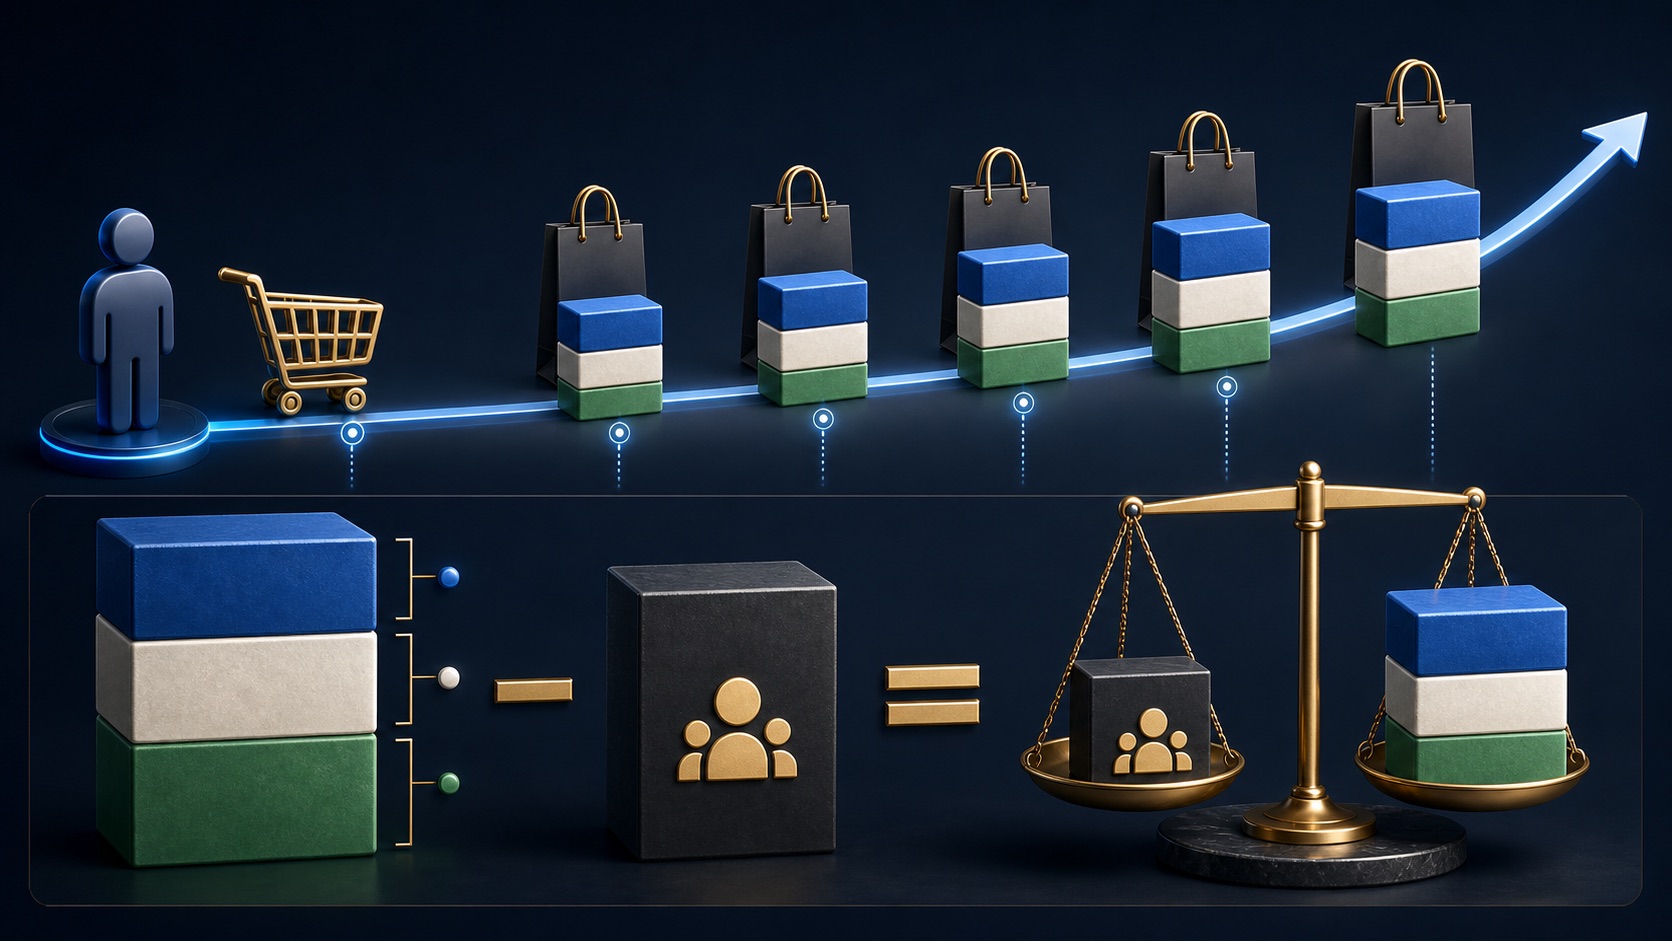
ILLUSTRATIVE CUSTOMER ECONOMICS
Revenue value is not contribution value
CLV WORKBOOK MAP
Build the model from observed cohorts
Group by first purchase or acquisition period, define active and churned, remove tests, and decide how refunds and reactivations are treated.
Measure purchase value, annual frequency, observed lifespan, gross margin, CAC, and timing; use simple formulas before predictive complexity.
Create conservative, base, and upside cases for lifespan, frequency, margin, and CAC, then make a decision that survives reasonable variation.
THE VALUE TIMELINE
Purchase value × frequency × lifespan × margin
THE LEAD ATLAS METHOD
When a growth plan identifies a high-value business segment, Lead Atlas Data can research a contact list specific to that segment’s categories, campaign market, and locations instead of supplying a generic audience.See how custom list research works ↗Choose the customer and time definitions
Decide whether the unit is a person, household, account, location, subscription, or business. Define first purchase, repeat purchase, active, lapsed, churned, reactivated, refund, and observation cutoff.
Group customers into acquisition cohorts so older customers do not automatically look more valuable merely because they have had more time to buy. State how incomplete recent cohorts are handled.
Calculate simple revenue CLV
A common simple model multiplies average purchase value by purchase frequency and average customer lifespan. Use consistent time units and observed transactions, then show the customer count and date range behind every input.
For subscriptions, another approach can relate average revenue and churn, but small samples and changing cohorts can make the estimate unstable. Choose the model the team can explain and reproduce.
Convert revenue into gross-margin CLV
Multiply the revenue estimate by gross margin, or calculate contribution by order when margins vary. Include appropriate variable costs such as cost of goods, fulfillment, shipping support, payment processing, and returns according to the business’s accounting policy.
Do not call the result net profit when fixed operating expenses, taxes, retention costs, and timing are excluded. Name the metric precisely so marketing and finance interpret it the same way.
Compare cohorts and acquisition economics
Join acquisition channel, offer, first product, location, or segment to each cohort. Compare CLV, CAC, payback, repeat rate, refund rate, and margin using the same maturation window.
A high projected CLV does not solve a long payback period or limited cash. Use realized early value and conservative assumptions when deciding how quickly to scale acquisition.
Complete the CLV sensitivity model
Create conservative, base, and upside cases for lifespan, purchase frequency, average value, gross margin, and CAC. Note which assumption drives the largest change and what real data will reduce the uncertainty.
Deliverable: definition sheet, cohort table, revenue CLV, gross-margin CLV, CAC and payback comparison, sensitivity chart, confidence note, and one acquisition or retention decision with a review date.
THE TAKEAWAY
Begin with a simple cohort-based estimate, convert revenue into gross-margin contribution, show uncertainty, and use CLV with CAC and payback—not as permission to overspend today.OFFICIAL REFERENCES