Frequency is an average of impressions per person in the selected reporting scope. Repeated exposure can support recall, but it can also coincide with shrinking reach, creative fatigue, or a small audience. Meta does not provide one universal frequency number that is safe or harmful for every objective, market, and period. This lesson builds a decision from trend and business evidence.
VISUAL LESSON
What you will learn
- 01Calculate and interpret average frequency.
- 02Distinguish repetition from creative or audience problems.
- 03Choose a controlled saturation response.
ILLUSTRATIVE WORKED EXAMPLE
Read an illustrative seven-day trend
PRACTICAL INTERFACE MAP
Turn a frequency alert into a controlled diagnosis
Choose campaign, ad set, audience, placement, geography, and a comparable date range.
Read reach, impressions, frequency, spend, qualified actions, negative feedback, and delivery.
Rotate creative, adjust audience, pacing, or schedule with a hypothesis and review window.
STEP-BY-STEP LESSON
Scope → exposure trend → customer evidence → one controlled response
THE LEAD ATLAS METHOD
For a campaign that needs another prospecting route, Lead Atlas Data can assemble business contacts specific to the same categories, locations, or market rather than forcing more impressions into a saturated audience.See how custom list research works ↗Calculate the metric in a fixed scope
Frequency is commonly understood as impressions divided by reach for the reporting scope. Because it is an average, some people may see the ad more often and others less. Changing the date range, attribution context, campaign level, or breakdown can change the number and the story.
Record start and end dates, account time zone, campaign level, included placements, audience, geography, objective, and whether the number is cumulative or daily. Never compare a three-day ad-set value with a thirty-day campaign average as if they are the same observation.
Build the exposure trend
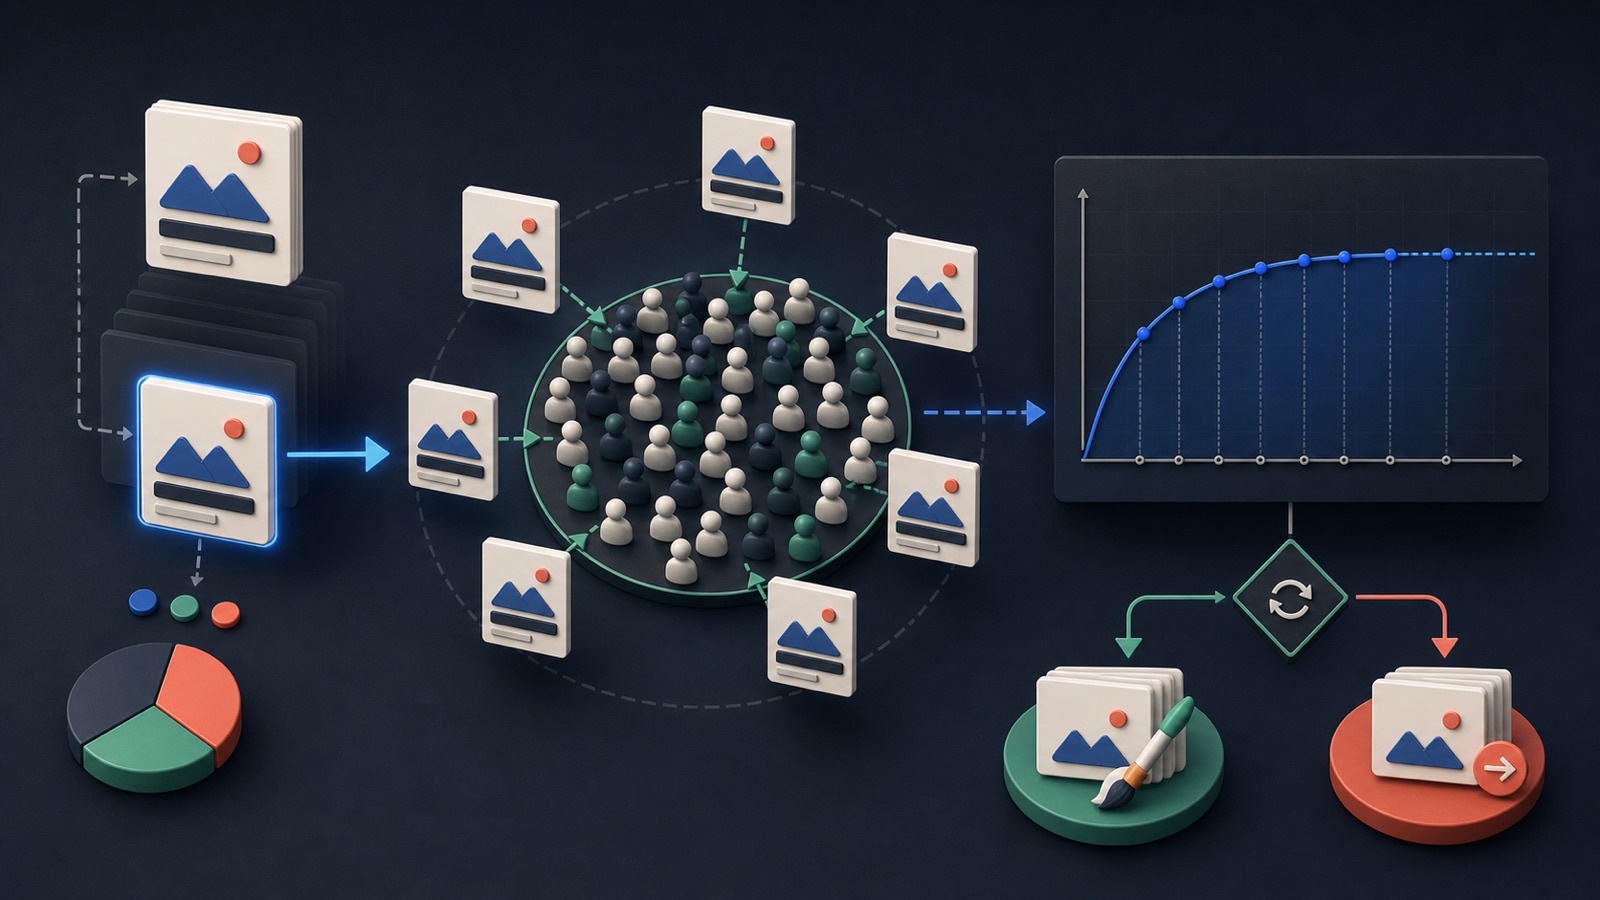
Chart reach, impressions, average frequency, spend, CPM, delivery, and audience size over comparable periods. Add creative age, budget edits, audience changes, exclusions, and promotion dates. A rising frequency with steady qualified outcomes can mean something different from rising frequency with collapsing reach and worsening customer feedback.
Create a daily or weekly table and annotate every meaningful campaign change. Look for when incremental reach slows, not just when an arbitrary frequency threshold is crossed.
Check response and customer quality
Review outbound clicks, landing-page behavior, form completion, qualified leads, sales follow-up, conversions, hides, comments, and other available quality signals. A weak result may come from the offer, destination, form, tracking, or fulfillment—not repeated exposure alone.
Sample recent responses and classify them as qualified, duplicate, irrelevant, unreachable, or customer. Compare the mix before and after frequency changed so the decision is grounded in business outcomes.
Test the likely constraint
If creative fatigue is the hypothesis, introduce a meaningfully different hook, proof, format, or visual while keeping the offer and audience comparable. If audience constraint is the hypothesis, review overlap, exclusions, geography, prospecting pool, and budget pressure before broadening responsibly.
Change one main variable at a time when practical, preserve the previous setup, and write the expected direction. A budget cut, creative refresh, and audience expansion made together may improve delivery but cannot teach which cause mattered.
Choose a governed response
Hold when results and customer quality remain acceptable; refresh creative when response decays across the same audience; adjust audience or pacing when incremental reach is constrained; pause when the offer, destination, tracking, or customer experience is unsafe. Recheck after an appropriate observation window.
Deliverable: fixed-scope frequency report, exposure trend, edit annotations, creative-age table, customer-quality sample, suspected-cause statement, one-variable test, stop conditions, next review date, and a documented hold, refresh, expand, pace, repair, or pause decision.
THE TAKEAWAY
Use frequency as a context signal, segment the trend, check customer-path quality, and change creative, audience, budget, or schedule only when the evidence supports a specific cause.OFFICIAL REFERENCES