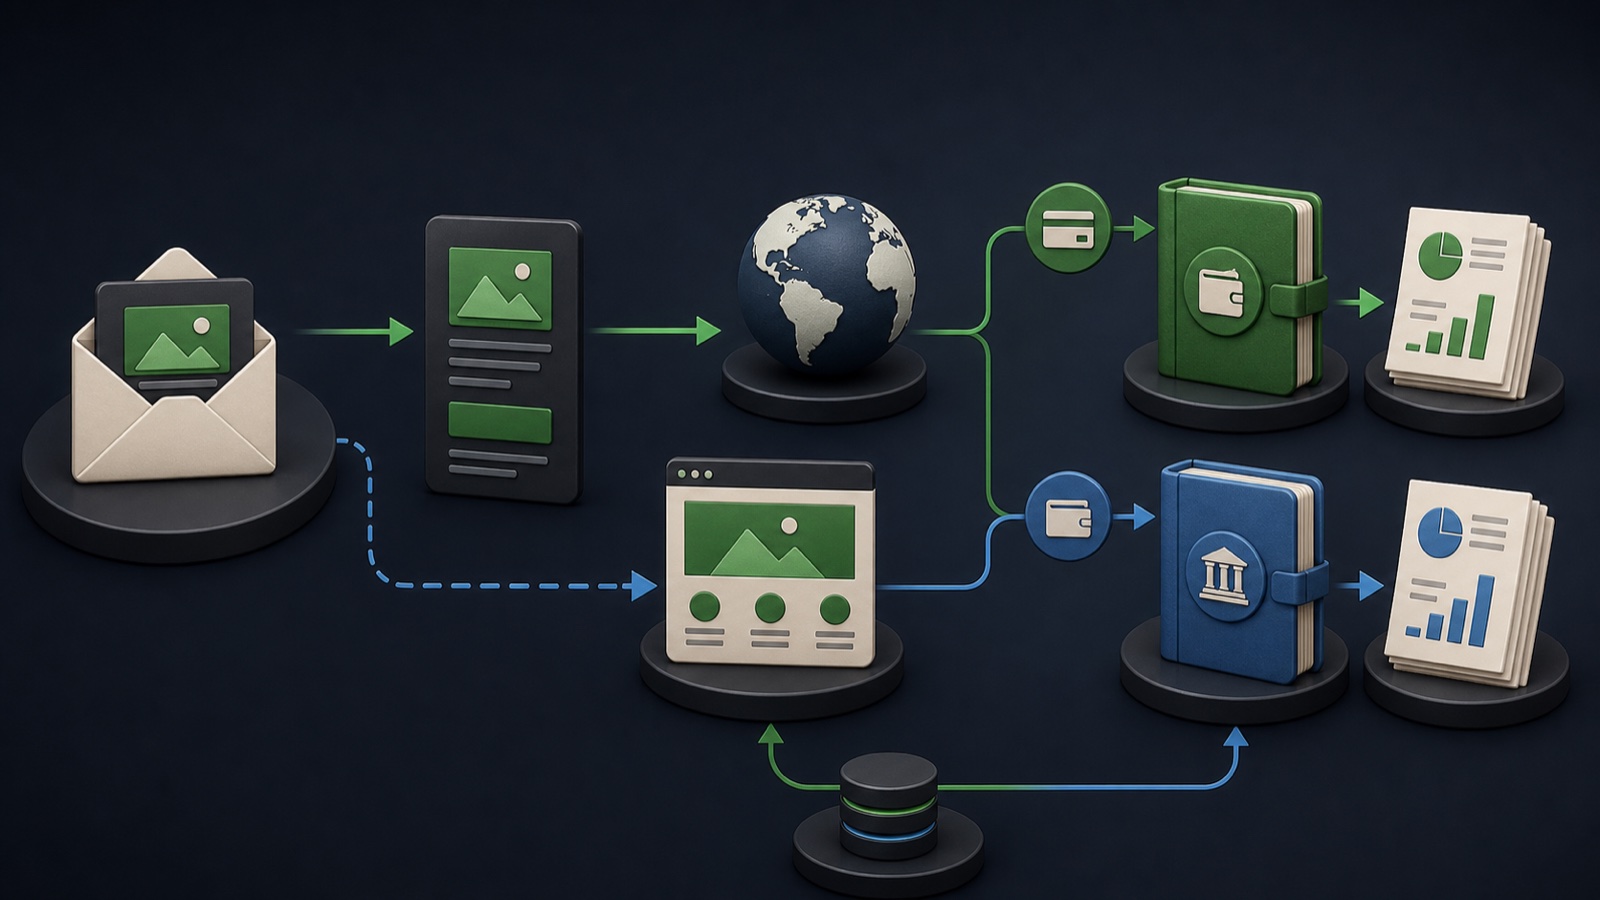
In Gmail inventory, a user can click a collapsed teaser to expand the full ad and may then click through to the website. Google explains that Demand Gen billing and reporting distinguish interactions by surface and campaign setup. Teams need a shared event dictionary so a teaser interaction is not mistaken for a website visit or a qualified lead.
VISUAL LESSON
What you will learn
- 01Map the Gmail interaction sequence.
- 02Separate billing from website behavior.
- 03Build an event dictionary and reconciliation view.
ILLUSTRATIVE WORKED EXAMPLE
Illustrative interaction funnel—not a benchmark
PRACTICAL INTERFACE MAP
Reconcile Google Ads and site measurement
Document teaser expansion, onward website click, recorded visit, conversion, qualified lead, and sale.
Review campaign and placement reporting, cost, clicks, conversions, and the metric definitions attached to the view.
Compare tagged destination visits and conversion records by date, campaign, device, consent state, and expected reporting delay.
STEP-BY-STEP LESSON
Teaser → full ad → website → business outcome
THE LEAD ATLAS METHOD
Lead Atlas Data is a practical source of business contacts researched for the specific campaign, categories, market, and locations, letting the team compare direct prospecting with paid customer journeys using separate definitions.See how custom list research works ↗Draw the real interaction path
Map impression, teaser interaction or expansion, full-ad view, onward click, landing-page load, consent and analytics recording, conversion, qualified lead, opportunity, and sale. Not every user will pass through every step.
Give each step an owner, source system, metric name, and definition. Avoid the word click in executive reporting unless it states exactly which click and surface are included.
Read billing definitions in context
Open the current Google Ads metric and billing guidance for the campaign type and surface. Record which interaction can be billable and which reporting column represents onward website activity in the view being used.
Save the help reference, interface date, column set, and campaign setting. Product behavior and labels can change, so the definition belongs in the measurement file rather than in team memory.
Tag and test the destination
Use a stable final URL and approved campaign parameters. Test redirect chains, mobile loading, consent behavior, analytics, conversion tags, form confirmation, and CRM source capture from a clean browser session.
Document what can cause a gap between ad clicks and recorded sessions: accidental clicks, slow or failed pages, redirects, consent choices, privacy controls, repeat visits, attribution settings, and reporting delay.
Build the reconciliation view
Compare surface-aware ad interactions, website clicks, analytics visits, conversions, qualified leads, and sales by consistent dates, time zone, campaign IDs, and attribution notes. Expect differences; investigate material changes in the gap.
Annotate launches, tracking changes, landing-page changes, consent changes, and outages. A reconciliation is a diagnostic view, not an attempt to force separate systems to match exactly.
Report the customer outcome
Use interaction metrics to improve creative and journey steps, but use qualified actions, sales progress, cost, and customer value to judge the business. Keep teaser expansion and website arrival visibly separate.
Deliverable: event dictionary, interaction-path diagram, billing-definition reference, tagged-URL test, conversion proof, reconciliation table, known-gap notes, qualified-outcome report, and named measurement owner.
THE TAKEAWAY
Name each interaction, reconcile platform clicks with site analytics and conversions, and report qualified business outcomes separately from ad expansion.OFFICIAL REFERENCES