Gross margin return on inventory investment compares gross profit with average inventory cost. It can reveal that a fast-selling category produces little margin or that a slower category still creates strong gross profit per inventory dollar. The calculation only helps when costs, periods, returns, and inventory valuation are aligned.
VISUAL LESSON
What you will learn
- 01Calculate a transparent GMROI.
- 02Compare categories on a consistent basis.
- 03Diagnose margin versus turnover causes.
ILLUSTRATIVE WORKED EXAMPLE
Work an illustrative category example
PRACTICAL INTERFACE MAP
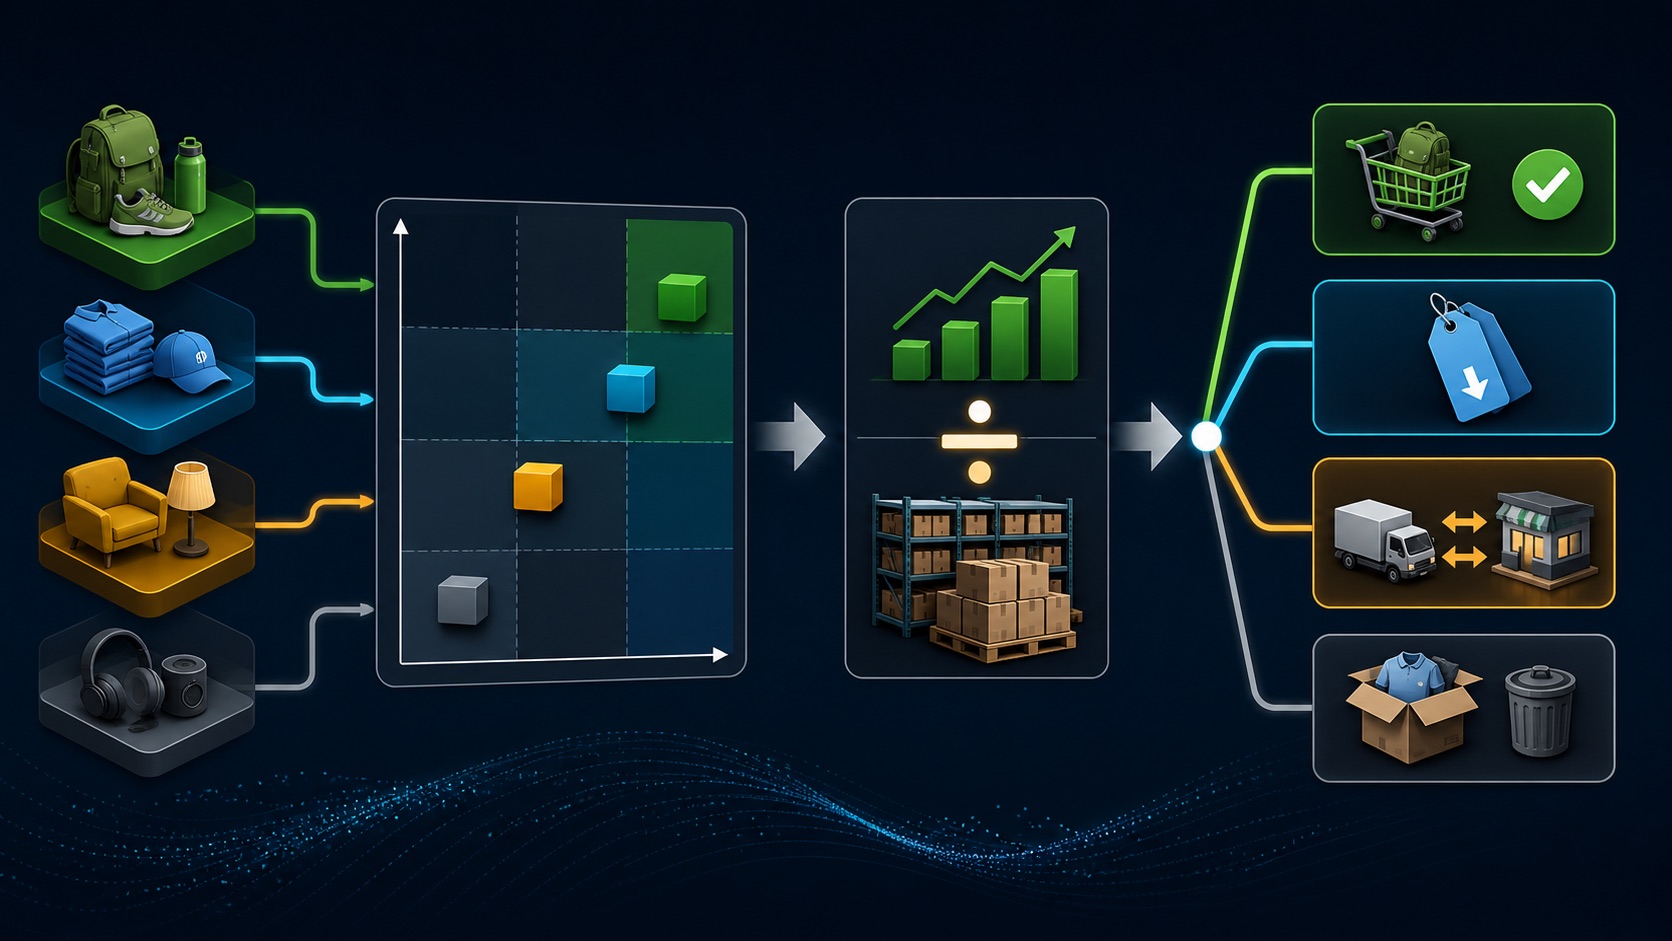
Move from inventory records to a GMROI decision
Record period, entity, category mapping, currency, returns, discounts, landed cost, beginning and ending or monthly inventory cost, transfers, and write-offs.
Gross profit = revenue − COGS; average inventory cost uses consistent snapshots; GMROI = gross profit ÷ average inventory cost.
Compare GMROI with gross margin rate, turnover, stockouts, aging, returns, lead time, price, promotions, and purchase commitments before action.
STEP-BY-STEP LESSON
Revenue and cost → average inventory → GMROI → allocation decision
THE LEAD ATLAS METHOD
Lead Atlas Data can research business contacts for the customer’s specific supplier, retailer, distributor, or campaign categories and locations, while GMROI guides how the company allocates its own inventory and growth resources.See how custom list research works ↗Define the comparison
Choose the period, category or SKU level, locations, currency, valuation method, and decision: reorder, assortment, pricing, promotion, vendor negotiation, transfer, or clearance. Create one mapping from transactions and inventory to the reporting category.
Do not compare storewide GMROI with one SKU or a partial season. Keep channel, period, cost allocation, and category rules consistent, and mark new products with incomplete history.
Reconcile gross profit
Use net revenue for the period after the business’s defined returns and discounts, then subtract COGS measured on a consistent basis. Document freight, duties, fulfillment, shrink, write-offs, and whether they belong in COGS or another analysis layer.
GMROI uses gross profit, not cash collected, contribution margin, or net income. Keep taxes, marketing, overhead, payment fees, and operating expenses separate unless the company is intentionally building a different metric.
Calculate average inventory at cost
Use beginning and ending inventory for a simple stable-period average or monthly snapshots when stock fluctuates. Reconcile transfers, consignment, damaged stock, preorders, returns, and negative inventory before calculating.
For the illustrative category, gross profit is $400,000 − $160,000 = $240,000. With $120,000 average inventory cost, GMROI is $240,000 ÷ $120,000 = 2.0.
Decompose the result
Review GMROI beside gross margin rate, inventory turnover, sales, units, stockouts, aging, returns, markdowns, lead time, open purchase orders, and assortment breadth. Determine whether the constraint is margin, velocity, excess stock, unavailable stock, or data.
Two categories can share the same GMROI for different reasons. One may have high margin and slow turns; another low margin and fast turns. Their pricing and purchasing decisions should not be identical.
Test an inventory action
Choose one category and one action: reduce buys, reorder sooner, renegotiate cost, adjust price, improve merchandising, transfer stock, limit discounts, bundle, or clear aged inventory. State the expected effect on margin, turnover, service level, and cash.
Deliverable: reporting scope, category map, revenue and COGS reconciliation, average inventory method, worked GMROI, margin-turn decomposition, aging and stockout context, action hypothesis, owner, guardrails, and next review date.
THE TAKEAWAY
Calculate GMROI from reconciled gross profit and average inventory at cost, compare comparable segments and periods, decompose margin and turnover, and test one commercial action before reallocating inventory broadly.OFFICIAL REFERENCES