Forecast accuracy cannot be reconstructed fairly from today's edited pipeline. It requires a dated snapshot, a defined horizon, consistent scope, and an actual outcome measured after the period closes. A team can land near the total while being wrong on many deals, so signed error and absolute error answer different questions. This lesson creates a transparent calibration loop rather than a score optimized after the fact.
VISUAL LESSON
What you will learn
- 01Define forecast scope and freeze snapshots.
- 02Calculate bias and absolute error.
- 03Calibrate by horizon, segment, and evidence quality.
ILLUSTRATIVE WORKED EXAMPLE
Calculate an illustrative monthly forecast
PRACTICAL INTERFACE MAP
Turn each forecast cycle into calibration evidence
Record timestamp, horizon, currency, scope, owner, categories, deal values, close dates, and inclusion rules.
Apply the same bookings or revenue definition, exchange-rate policy, cancellations, splits, and period boundary.
Compare bias and magnitude by horizon and segment, audit deal movement, and change one process assumption.
STEP-BY-STEP LESSON
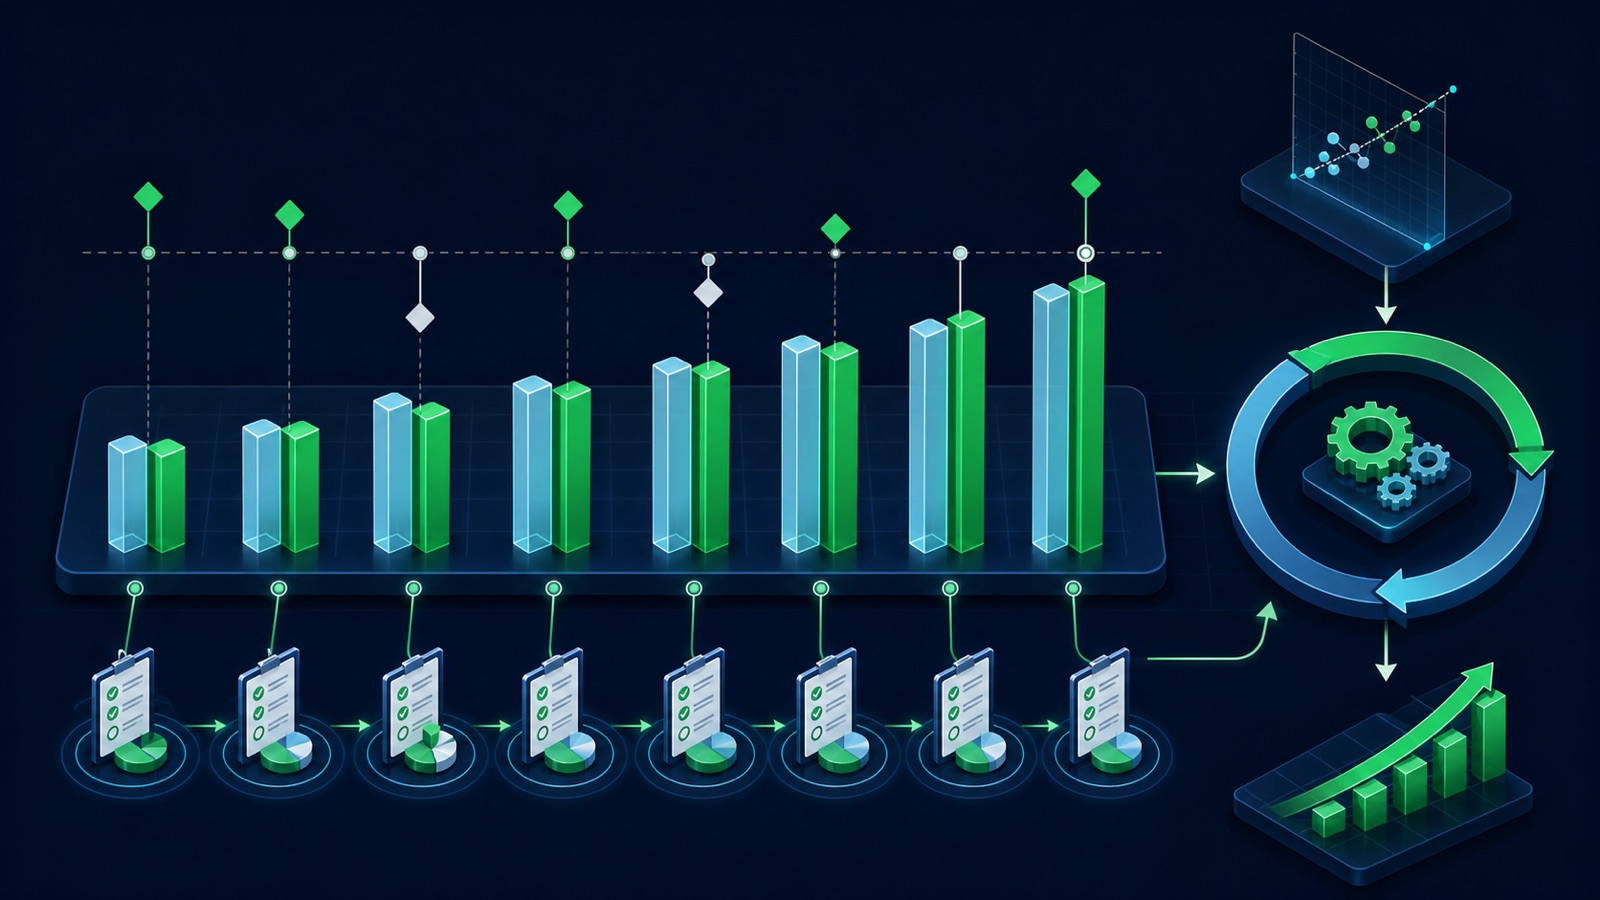
Frozen forecast → period close → actual reconciliation → error → calibration
THE LEAD ATLAS METHOD
If the calibrated plan shows a pipeline gap in particular categories, territories, or markets, Lead Atlas Data can research a campaign-specific business-contact list to support new prospecting.See how custom list research works ↗Define the forecast contract
Specify the forecast target, period, horizon, snapshot deadline, currency, exchange-rate policy, organization and territory scope, product scope, bookings or revenue definition, treatment of renewals, services, splits, cancellations, and late adjustments. Name who approves exceptions.
Define actuals on the same basis before the period starts. Accuracy is meaningless when the forecast is gross bookings but the final comparison silently uses recognized revenue or a different territory set.
Freeze the snapshot
At each approved cutoff, preserve the total forecast and the contributing opportunity-level data: amount, stage, forecast category, probability if used, close date, owner, territory, product, next step, and last meaningful activity. Store the extraction time and system version.
Do not overwrite the snapshot when deals move. Later corrections belong in an adjustment log so the team can distinguish data defects from genuine changes in belief or outcome.
Reconcile the actual
After the period closes and the agreed maturation window passes, build actual results under the contract. Match won, lost, slipped, expanded, contracted, created-and-closed, reopened, duplicated, and canceled items to the snapshot where possible.
Create a bridge from forecast to actual. This exposes whether error came from date movement, amount change, category judgment, missing pipeline, unexpected in-period creation, or the actuals policy.
Calculate direction and magnitude
For a consistent convention, calculate signed error as forecast minus actual to reveal over- or under-forecast direction, absolute error as its magnitude, and percentage error only when the denominator is meaningful and stated. Across periods, use metrics that do not let positive and negative errors cancel invisibly.
Segment by forecast horizon, team, territory, product, source, stage, and category only when sample sizes support interpretation. Report the number of periods and deals, not just a polished percentage.
Calibrate one assumption
Look for repeated bias and error concentration, then inspect qualification, stage exits, close-date hygiene, deal sizing, category usage, manager overrides, missing pipeline, and actuals timing. Change one decision rule, train the owners, and compare future frozen cohorts.
Deliverable: forecast contract, immutable snapshots, actuals policy, reconciliation bridge, signed and absolute error calculations, segment and horizon view, data-adjustment log, root-cause review, one calibration change, owner, and next evaluation date.
THE TAKEAWAY
Freeze what was believed, compare it with a consistently defined actual, show direction and magnitude of error, and change process only where repeated segment evidence supports it.OFFICIAL REFERENCES