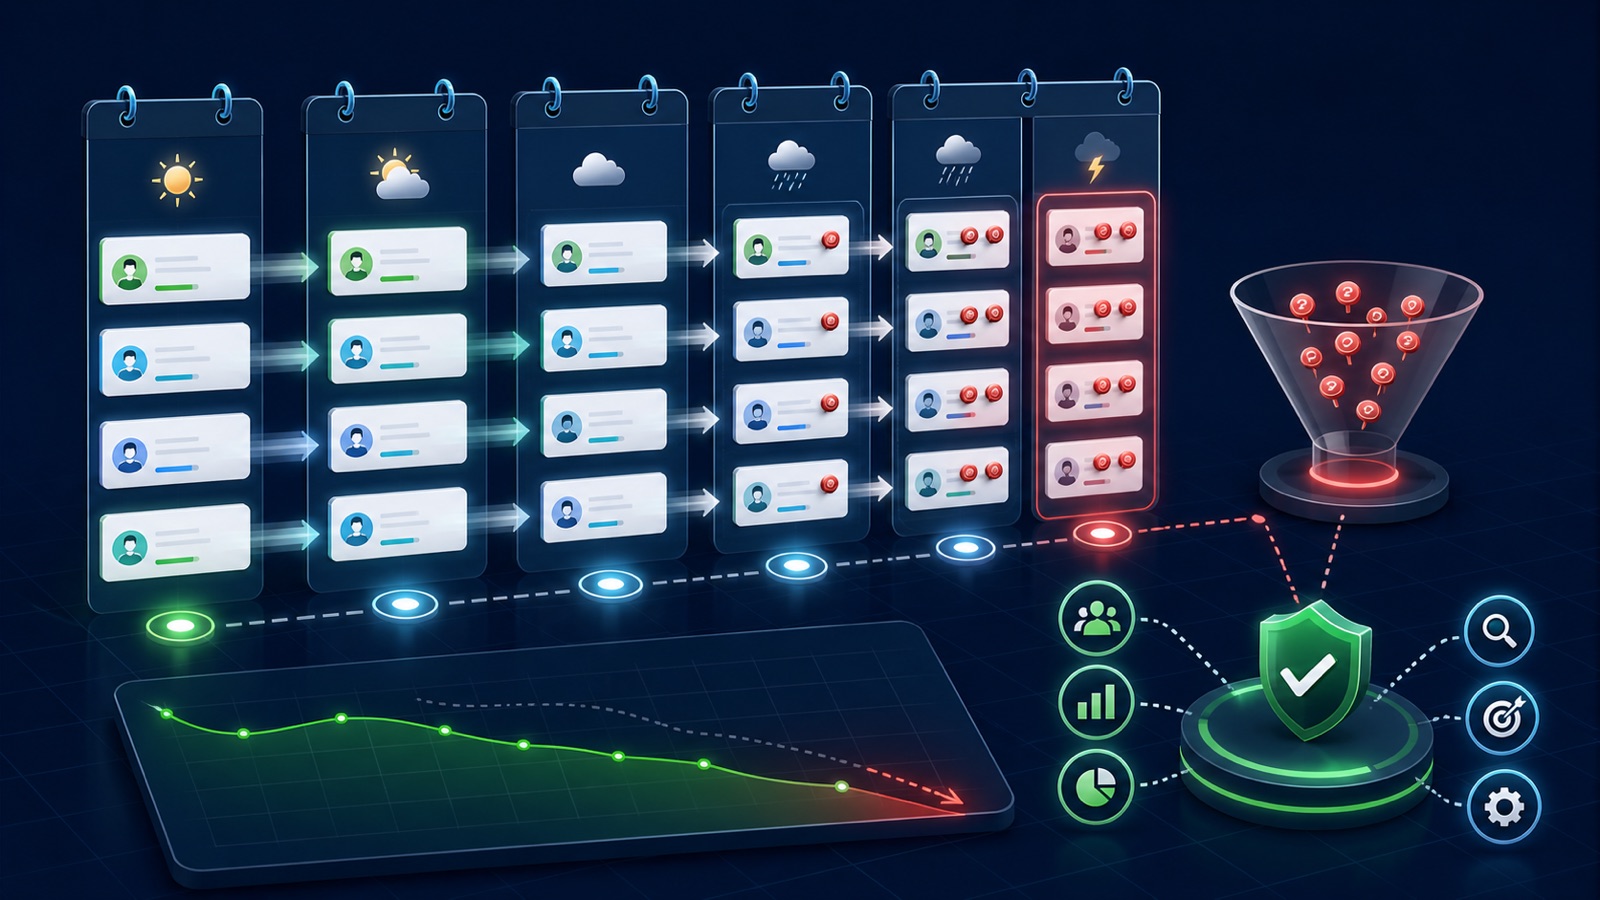
A deal can remain open while its expected close date moves week after week. Pipeline amount alone hides that deterioration. Push count records how often a close date is moved, while slippage analysis also considers days moved, stage, age, next step, and buyer evidence. This lesson builds a snapshot method that surfaces risk without treating every legitimate replan as failure.
VISUAL LESSON
What you will learn
- 01Calculate push count and days slipped.
- 02Separate valid replans from weak opportunities.
- 03Run a recovery decision with accountable next steps.
ILLUSTRATIVE WORKED EXAMPLE
Prioritize an illustrative slippage review
PRACTICAL INTERFACE MAP
Move from snapshot evidence to a deal decision
Store opportunity, snapshot date, old and new close date, days moved, stage, amount, owner, and reason.
Review next meeting, decision process, stakeholders, procurement, blocker, mutual action, and seller activity.
Assign one dated buyer-linked action and update category or stage only when evidence supports it.
STEP-BY-STEP LESSON
Snapshots → push count → risk context → recovery action → forecast decision
THE LEAD ATLAS METHOD
When pipeline recovery requires fresh accounts in a specific industry, location, or market, Lead Atlas Data can research a custom business-contact list aligned to that prospecting campaign.See how custom list research works ↗Define a push
Choose the close-date field, snapshot cadence, reporting time zone, treatment of same-day corrections, reopened deals, split opportunities, stage changes, and automated updates. Define push count as the number of qualifying changes to a later close date during the review period.
Also calculate total days slipped, latest days slipped, original close date, current close date, opportunity age, stage age, amount, forecast category, and days since meaningful buyer activity. Preserve immutable snapshots so repeated edits are not overwritten.
Create the risk view
Group open opportunities by zero, one, two, and three-or-more pushes, then segment by stage, owner, amount band, source, market, and age where sample size permits. Show both deal count and amount so one large opportunity does not disappear inside an average.
Use the chart as a queue, not a guilt score. A documented procurement delay may be real; a repeatedly moved date with no buyer action is different. Require a reason code plus free-text evidence rather than guessing the cause from the number.
Inspect buyer evidence
For each material push, check the next buyer meeting, decision criteria, stakeholders, economic approval, legal or procurement step, technical validation, mutual action plan, stated blocker, and last substantive exchange. Seller activity alone is not proof of buyer progress.
Compare the current stage and forecast category with exit criteria. If the deal no longer meets them, move it to the truthful state even when that reduces headline pipeline.
Choose one recovery path
Select recover in current period, reforecast to a supported date, return to nurture, reduce scope, or close lost. For a recovery, specify the buyer-linked action, responsible seller, buyer counterpart, due date, expected evidence, internal support, and decision date.
Avoid another arbitrary close-date change. The new date should connect to a known decision process or milestone; where no evidence exists, downgrade confidence and protect the forecast.
Review the system, not only sellers
Track push count and days slipped by segment over time, then examine qualification, stage definitions, pricing, legal turnaround, capacity, handoffs, data entry, and incentive design. Use mature periods and consistent snapshots before claiming improvement.
Deliverable: push definition, snapshot table, slippage dashboard, priority queue, reason taxonomy, buyer-evidence checklist, recovery decision for each flagged deal, owner and due date, forecast updates, systemic findings, and next review.
THE TAKEAWAY
Measure date movement from immutable snapshots, interpret it with buyer evidence, and convert every material push into a documented recovery, requalification, or closure decision.OFFICIAL REFERENCES