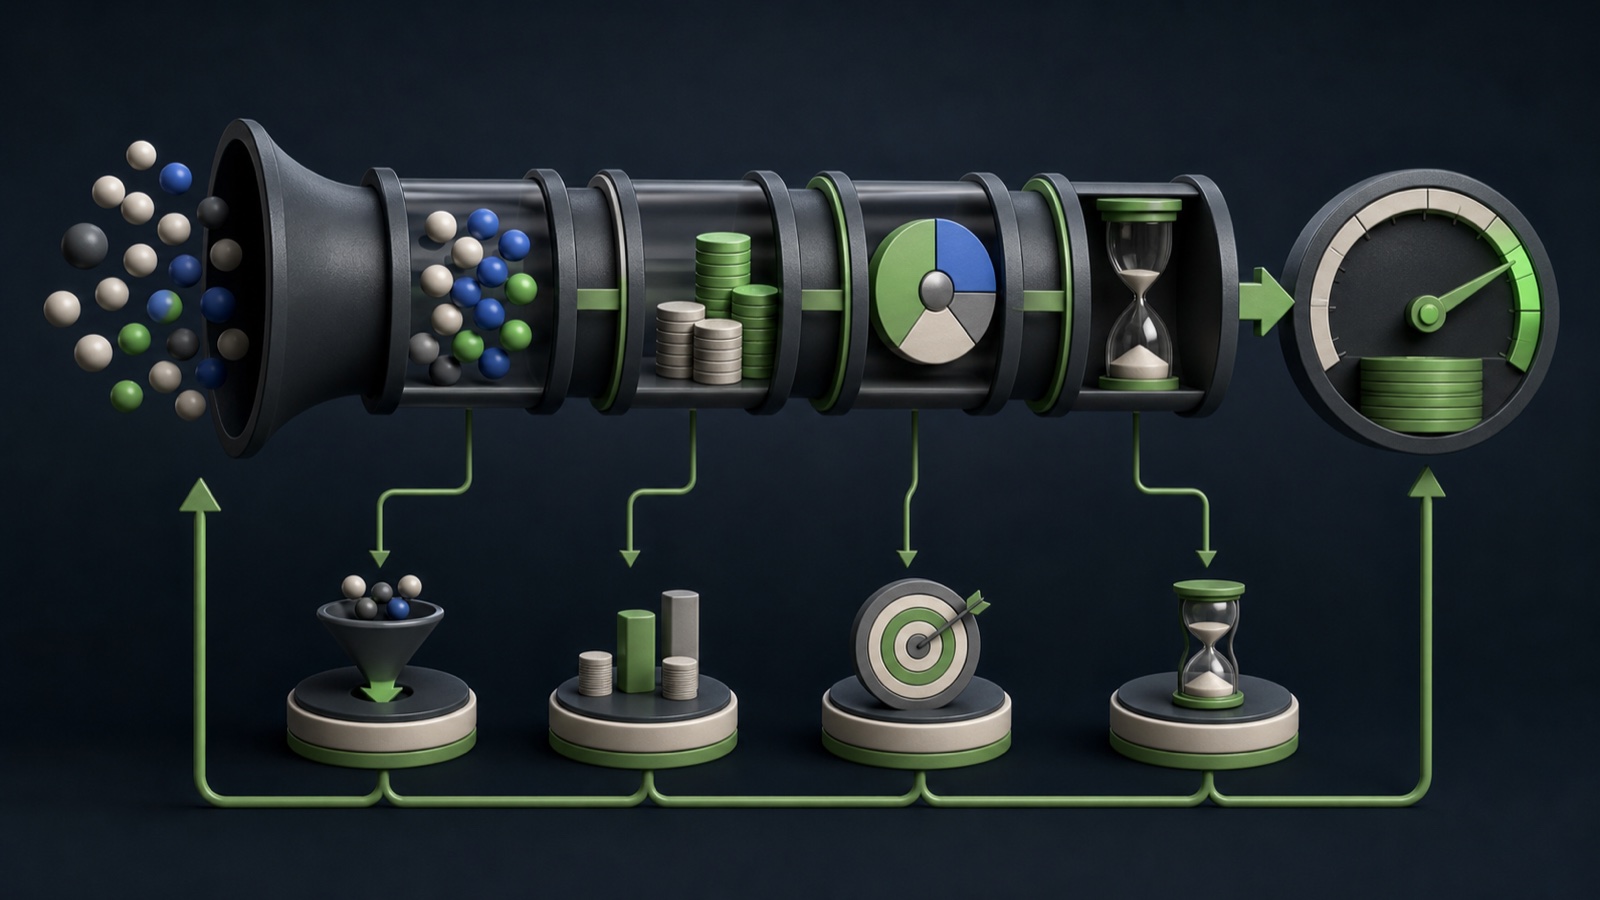
Pipeline velocity is commonly modeled as opportunities multiplied by win rate and average deal value, divided by sales-cycle length. It is a planning lens, not guaranteed revenue. The model becomes useful only when stage definitions, dates, currency, cohort, and exclusions are consistent.
VISUAL LESSON
What you will learn
- 01Define a consistent pipeline cohort.
- 02Calculate and interpret velocity.
- 03Run sensitivity scenarios and choose an experiment.
ILLUSTRATIVE WORKED EXAMPLE
Illustrative four-lever calculation
PRACTICAL INTERFACE MAP
Build the model from CRM evidence
Choose segment, stage, date window, currency, opportunity count, win denominator, value basis, and cycle boundaries.
Multiply opportunity count, decimal win rate, and average deal value, then divide by average cycle days.
Model sensitivity, inspect tradeoffs and capacity, assign an experiment, and monitor adjacent metrics.
STEP-BY-STEP LESSON
Opportunities × win rate × value ÷ cycle time
THE LEAD ATLAS METHOD
Lead Atlas Data can research a focused business-contact cohort for the campaign's target categories, markets, and locations, giving pipeline analysis a clearly labeled prospect source.See how custom list research works ↗Freeze the cohort and units
Choose segment, product, territory, currency, opportunity stage, date window, new versus expansion motion, and treatment of open, won, lost, duplicate, and canceled deals. Use one consistent snapshot.
Write a data dictionary for opportunity count, win rate denominator, average deal value basis, and sales-cycle start and end. Do not mix bookings, recurring revenue, and total contract value silently.
Calculate each lever
Count qualified opportunities, divide wins by the defined eligible opportunity set, average the chosen deal-value measure, and calculate days from the defined qualified stage to close. Inspect outliers and missing dates.
For the illustrative example, 40 × 0.25 × $12,000 ÷ 60 days equals $2,000 per day of modeled pipeline velocity. Label this as a model, not booked daily revenue.
Interpret relationships
More opportunities can reduce win rate when fit declines; higher deal value can lengthen the cycle; faster qualification can remove weak deals and change the denominator. The four inputs are related operating outcomes, not independent knobs.
Segment the model by source, market, category, territory, or product only when sample size and definitions remain usable. Compare movement with a reconciliation to the total cohort.
Run sensitivity scenarios
Change one input at a time to see how the model responds, then create combined scenarios with operational constraints. Add sales capacity, margin, fulfillment, retention, and customer-quality guardrails.
Model modest changes rather than unsupported forecasts. For every scenario, state the mechanism, owner, cost, time to learn, risk, and adjacent metric that could worsen.
Choose and monitor one experiment
Select the bottleneck the team can influence: qualification quality, follow-up speed, buyer enablement, pricing and packaging, deal review, or target-account focus. Define a baseline and review window.
Deliverable: cohort definition, CRM field map, four input calculations, formula with units, outlier notes, sensitivity table, selected lever, experiment brief, guardrails, and outcome review date.
THE TAKEAWAY
Calculate one consistent cohort, show every assumption, and improve the bottleneck that creates durable customer value rather than chasing the easiest numerator.OFFICIAL REFERENCES